
The economic and political landscape continues to be positive for equities and challenging for fixed income. The result of the French election was a huge relief and a significant boost for European markets. The fear of the disintegration of Europe would appear to have receded and provides investors with a more stable backdrop, which has been lacking for quite some time now. Although, we must be mindful that the Italian election could still deliver a significant wobble. The UK is heading for a general election which is looking much less likely to deliver the huge landslide that the polls first predicted. Indeed, it is looking a bit unsettling for the Conservative party as the election draws ever nearer. We do know, though, that polls can be very unreliable. In the US, Donald Trump’s regime appears to lurch from crisis to crisis with little achieved so far. Economic data remains broadly encouraging.
In Europe, earnings have been weak for a decade and we saw significant short-term policy risks in the form of the Dutch, French, German and Italian elections this year. Clearly, the risk from the Dutch and French elections has now diminished – with both Geert Wilders in Holland and Marine Le Pen in France failing to gain enough support to extend the Trump/Brexit nationalist theme. The CDU in Germany appears to be consolidating its position – but the Italian election that is likely over the next year remains a risk.
With electoral risks substantially diminished, the boost to corporate fundamentals now has the scope to be valued. Earnings’ reports this past quarter have been their strongest in 10 years, and the operational leverage attached to European firms looks likely to turn from a drag to an advantage for investors in the environment of reflation that is expected. There also appears to be a lot of pent-up demand for European equities following years of outflows, particularly from Asian and US investors who have disliked the region since the Greek crisis.
In the US, President Trump’s inability to implement his policies is in some ways positive, and in others negative, for equities. On the positive side, the disruption from the pursuit of a heavily protectionist agenda has reduced, but on the negative side so has the scope for delivery on a major corporate tax cut that the market has in many cases incorporated into valuations. The Federal Reserve has begun its tightening cycle but it is considered unlikely by many commentators that Fed hikes will cause equity markets to sell-off.
The cloud that hung over Emerging Markets is lifting as the threat of a trade war with the US recedes. Compared to the turn of the year the outlook is more optimistic as external challenges ebb. A weakening US dollar, the reduced likelihood of a steep trajectory in US rate hikes and strong Chinese economic momentum have proved positive surprises. There is more optimism now than at the start of Donald Trump’s Presidency. Even after the recent rally, emerging market equities are trading on valuations that appear attractive considering their superior long-term growth prospects, similar return on equity and lower valuations relative to developed markets.Higher commodity prices, a stable and lower US dollar and encouraging global trade have been the main cause of this earnings revival. We still prefer the Pacific emerging markets rather than the whole of the emerging market geography.
All of the above should contribute to a more constructive investment environment in which favouring equities ought to contribute positively to portfolios, but for pension portfolios it remains essential to have defensive assets. We must be mindful that this has been an enormously positive run for equities and be wary of over-realistic expectations. Are we climbing the wall of worry?
“Sell in May and go away,” so the old stockmarket adage goes. The theory is that (for UK markets) you should sell in summer months because they are usually the worst performing. So investors should sell in May and hold cash until early September – until the St Leger horse race. Should they? During the month, Schroders published a paper exploring the myth or reality of this old wives tail. The data analysed by Schroders offers a mixed picture for the UK’s most famous stockmarket superstition. Since 1986 the FTSE 100 has, on average, fallen a fraction between mid-May and mid-September. However, the FTSE 250 has typically risen. The FTSE 250 offers the highest historic returns of 0.82% for the summer months, with marginal loses for the other two. If you take an average of all three indices, the rise has been marginally positive at +0.10%. The summer period has also produced more positive years than negative ones. In the thirty one years since 1986, seventeen summers have produced a positive return. The chart shows the probability of UK markets falling for each month of the year. It combines the FTSE 100, FTSE 250 and the FTSE All Share to produce an average, since 1986.
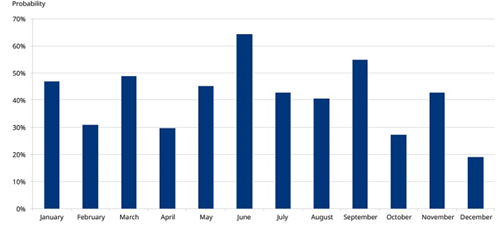
The summer months do seem to witness a fall more often than other months, although January and March also seem to struggle. However, with only two of the summer months above 50%, it’s difficult to draw meaningful conclusions. Previous studies have found patterns. A paper published by the American Economic Review in 2002, “Feed a cold and starve a fever”, found certain European countries, such as the UK, showed evidence of the sell-in-May effect dating back as far as 1694.
A variety of theories have tried to explain the pattern. Apart from lower trading volumes, others thought the sell-in-May effect could be explained by the timing of the tax year and even general over-optimism among investors in the spring. Forecasting markets is difficult enough let alone trying to identify seasonal or monthly patterns that may be repeated. As we know, past performance is no guide to the future. We also know that modern markets are far more globalised while better technology keeps investors connected even if they are out of the office, which was not the case in the past. As a case in point, consider the ‘sell in May’ adage for 2016. Those who sold at the FTSE 100’s highest point of the year in May, at 6271 points, would have missed out on an 8% gain by St Leger Day.” By 10 September, the FTSE 100 had reached 6777.
A separate Schroders study, published in May, of Asian markets looked at the Halloween effect, the Asian market’s name for “The Sell in May” which runs over almost the same period May to October rather than September. According to their calculations, over the period of 1990-2016 the regional Asia ex-Japan market has typically delivered a median return of +2.8% over the months of May to October, with the returns in 17 of those 27 periods being positive. Only the MSCI Taiwan Index delivered a median return of -6.0% during those months.
Schroders concluded “Those looking to turn to cash this month and return in September again this year do so at their own risk. A far better approach is to think long term. Make sure you have a clear investment plan and stick to it.” We echo that view and endeavour to stick with that philosophy.
To underline the point, Schroders analysed price data from the last ten years of the S&P 500. The return has been 65%. But if you take out the ten best trading days, the return is just 13%. Take the worst ten out and it is 72%. What these numbers don’t show is that the best and worst days are extremely close together.
Nine of those worst days occurred within ten weeks of each other. Eight of the best days were also in that same time period. Predicting when those days will occur is impossible.
Perhaps the St Leger Day wives’ tale should be put to bed, in the UK and Asia at least. American economist Paul Samuelson said: “Investing should be more like watching grass grow…if you want excitement, take $800 and go to Vegas.” Invest for the long term – not just for one season – and give your investments the best chance to grow”. Sounds like good advice and advice we subscribe to.