A New Investment Landscape: Volatility, Conflict, and Rising Prices
It used to be that investment professionals studied rafts of data to reach a view on a potential investment. Since Donald Trump arrived in the White House, it is Trump’s Truth Social account that is vital reading as his frequent overnight pronouncements move markets, cause commodities to rollercoaster and set the geopolitical tone. As we all know, the pronouncements can be reversed or upended as quickly as they were delivered. Trump’s news has a very short shelf life, and this topsy turvy behaviour is a very new scenario for all investors. Markets are also having to come to terms with this new landscape.
Over the last two months the conflict in Iran has been front and centre of the news. What was viewed by the White House as a quick incursion to achieve exactly what has never been clear. The reasons change frequently, often following the latest action rather than setting the strategy. What the President and the global economy have discovered is that the Strait of Hormuz is important to world trade and needs to be kept navigable. It is surprising if this was not known but it certainly appears to have caught the US out. The result is almost unavoidable inflation as oil prices rise and fertilisers become more expensive, which will inevitably cause food prices to increase. Inflation is likely to force central banks to raise interest rates which is the opposite of what had been anticipated this year.
Navigating Uncertainty: Stability Through Multi-Asset Investing
It is a bleak landscape, but markets have been surprisingly resilient, and we have seen some record highs in the US despite all the rhetoric and gloom. UK and European markets have also been quite resilient but not to the same level as the US. Investors have perhaps learned to dismiss much of the noise and attempt to peer through the fog of confusion and conflicting statements to concentrate on the fundamentals whilst taking opportunities that arise.
Our approach to portfolios has been to maintain our positions and let the managers take the rudder and change course as necessary. We have been pleased that our multi-asset exposure has delivered through this highly unusual period and provided the stability we wanted.
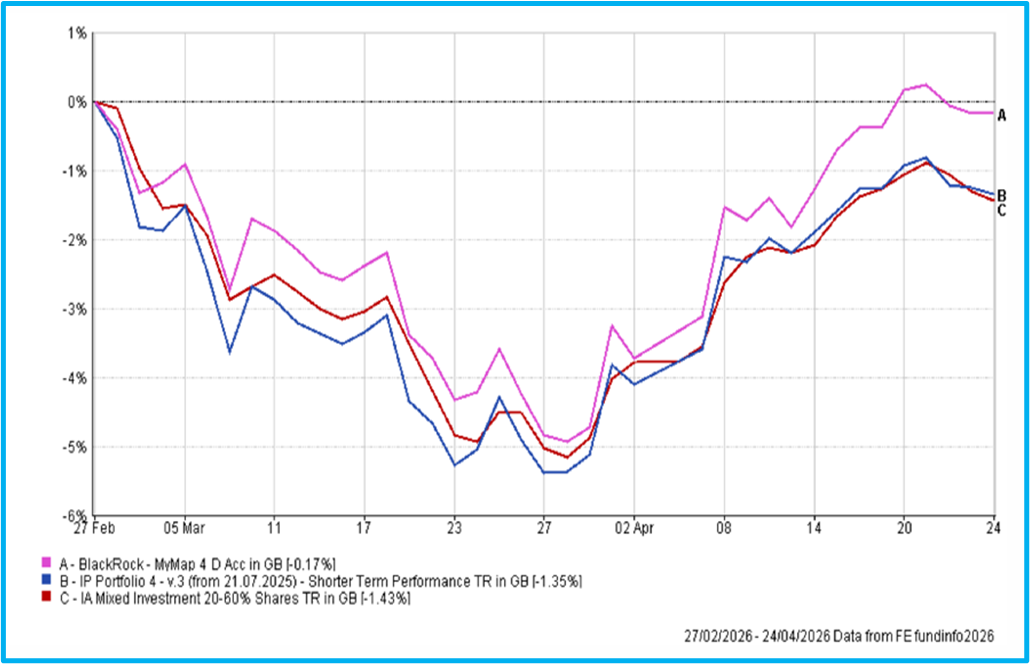
In the first chart on the left we show our Risk Rated Portfolio 4 over the turbulent two months since the start of the Iran conflict. We highlight the performance of the largest holding in the portfolio, BlackRock MyMap 4 D Acc.1
As can be seen, the multi-asset BlackRock fund held up well over this extremely volatile period. It outperformed the portfolio and the benchmark and along with other multi-asset funds, provided the robustness and stability desired. It also provides confidence that short-term volatility can be managed satisfactorily using such funds.
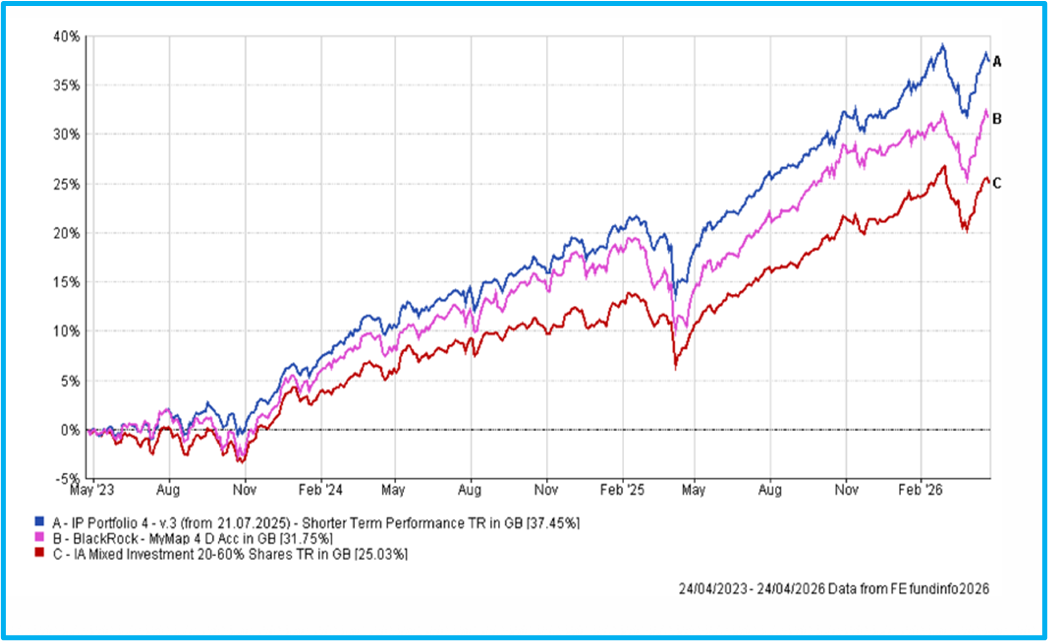
The second chart shows the same Risk Rated 4 portfolio over three years.
This shows that whilst the multi-asset fund, BlackRock My Map 4 D Acc, made a significant contribution to performance, the benefits of diversity and the addition of single strategy active funds were rewarded. The blending of multi-asset funds and single strategy funds is delivering in challenging market conditions that have been with us for several years now and the outlook continues to appear unsettled.
Views from the BlackRock MyMap Team
We thought we would share the recent views of the BlackRock My Map team2 as this is the largest holding in almost all of our risk-rated portfolios: “In our view, the market is going to be characterised by three key themes over the coming 6 – 12 months. Below we outline these themes and highlight the positions we are taking within MyMap to benefit from them.
The portfolios have proved resilient during the market volatility so far this year: benefiting from our decision last quarter to reduce stock market exposure. Looking forward, the global economy is strong (particularly in the US), companies remain profitable, and government spending is supportive. As a result, we have taken the recent dip in markets as an opportunity to add to our stock market exposure. However, we have also opened a position in inflation-linked bonds to steady portfolios against rising inflation and continue to hold gold given its ability to support portfolios during periods of uncertainty.
The stock market has been on a strong run over the past few years; however, returns have been concentrated in a handful of companies. Going forward, we expect the rest of the market to begin catching up. In light of this, we have introduced a US Value exposure and added a holding in infrastructure to portfolios. Both investments provide access to relatively undervalued areas of the market and are well positioned to benefit from the expansion in real economic activity. We also retain our tilt towards emerging markets, which look cheap, and where profits remain robust.
We expect the trend of deteriorating public finances to continue as governments spend to stimulate their economies, defence budgets are increased, and interest rates remain elevated. Considering this, we remain focused on shorter-dated developed market government bonds and in March we reduced our exposure to the US dollar. By contrast, we like emerging market government bonds, which pay an attractive level of income, even though public sector spending is contained”.
The VIX Debate: Signal or Noise for Investors?
As many readers of our Investment View will be aware, we use the VIX index to manage trading and timing risk. The VIX is a real-time market index representing the market’s expectation of 30-day forward-looking volatility of the S&P 500. Also known as the “fear index,” it measures market risk and investor sentiment, typically rising when the market drops and falling when it is calm. It is currently around 20 which is considerably lower than the peaks of Covid or the Global Financial Crisis. A recent article in the Financial Times3 about the VIX might bring some cheer to the many nervous (normal) investors who become anxious as volatility grips markets.
The article by Grace Peters, co-global head of investment strategy for JPMorgan Private Bank, looks at what should be done when the VIX rises above the key threshold of 30 – as it did most recently on 30th March 2026. This indicates a degree of uncertainty in markets that might result in some investors reining in their equity positions, whereas Peters’ view is that historical analysis suggests this could be a time to buy.
It is an article worth reading, not least because it created quite a response with the many comments including a joint letter from two professors in the Financial Times4. The professors suggested that the VIX should not be viewed solely as a contrarian “buy” indicator, but as a composite measure blending sentiment with forward-looking information embedded in options markets. Recognising this distinction could help investors better understand when volatility spikes represent opportunity and when it doesn’t. That seems quite a complicated response, but it is complicated. We hear frequently of “buying the dip”. The danger of buying the dip is you risk catching a falling knife. Nothing is quite as easy as simply buying the dip. Even fund managers can get this badly wrong.
By the time you read this, the President may have headed off on another path or venture. The last two months have plenty of investors shaking their heads in disbelief. The war has driven up costs for many companies and consumers and raised the prospect of another huge wave of military spending by already-indebted countries. Generally, the world is a more unsettled place but thankfully portfolios have been resilient so far. As we head towards May, oil is now reaching a 4-year high so the next few weeks will be critical. Inevitably, this is likely to spike volatility once again unless a lasting ceasefire can be concluded.
Douglas Kearney C.A. Investment Director
The above article is intended to be a topical commentary and should not be construed as financial advice. Past performance is not an indicator of future returns. Any news and/or views expressed within this document are intended as general information only and should not be viewed as a form of personal recommendation.
References:
1 Source: FE Analytics
2 Source: BlackRock Marketing Communication dated 16th April 2026: Markets moved. Here’s how your MyMap portfolio responded. A copy of this communication can be provided on request.
3 (Source: The Vix indicator of the time to buy published 14th April 2026)
4 Source: Letter: Vix — more than an index of behavioural overreaction: published 22nd April 2026.