It has been another period dominated by politics and policies mostly emanating or caused by the occupant of the Whitehouse. For all the current bluff and bluster of the world’s political leaders, what matters most for an investor is what is going on in the real economy; are the companies in which you invest still prospering, are jobs being created and are the prices of goods and services well-behaved. On all three counts, the answer currently is an emphatic, yes.
Corporate profits are on the up, led by firms in the US where earnings are growing by over 20% (with less than half of that due to Trump’s tax cuts). While elsewhere, around half of European and Japanese firms are beating estimates for Q2 earnings. Moreover, measures of corporate sentiment remain buoyant despite all the headlines and are being reflected in capital investment plans.
Jobs are being created and most notably in the UK and US where unemployment rates are at historic lows; they look likely to head lower. Nowhere economically significant is inflation (or deflation for that matter) a problem. Indeed, price stability, despite all the changes of recent years, across the major economies is a success story. Some of the forces behind this, including demographic trends, may yet generate stresses and strains for investors but these are glacial and not likely to create sudden market dislocations.
The global economy has still not seen the ripple from global growth and low unemployment rates into significantly higher wages and inflation. That would be pivotal for fixed income and other markets. As long as there is a lid on inflation, bond yields are not going to normalise and will remain low and equities broadly high.
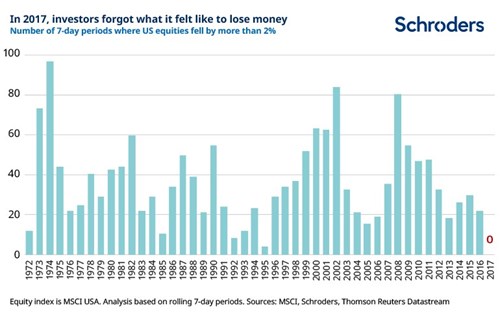
Meanwhile, the US economy seems to be booming (Q2 growth could breach 5% at an annualised rate) – admittedly probably boosted by some front-loading of international trade ahead of the threat of tariffs. Altogether the global profits outlook looks good. Despite volatile markets and trade wars, the S&P 500 reached new highs along with Nasdaq. We all know equity investing carries risk. You can lose money. In economic and political terms, it is easy to see lots of risk out there. But equity markets have been behaving rather differently. Last year was the first time in 35 years (which is as far back daily data allows) when there wasn’t a single seven-day period where US equities fell by more than 2%. It’s a reminder of the calm progress made by equities last year. But it also raises the possibility that investors may have forgotten what it feels like to lose money. This is not “old” normal and likely not “new” normal either. Investors need to beware of complacency or falling prey to “recency bias”, a common behavioural trap where the future is assumed to be like the recent past.
Risk means more things can happen than will happen. Just because you didn’t lose money last year doesn’t mean you can’t lose money this year. We are very mindful of that but selling at the wrong time can be a risk.
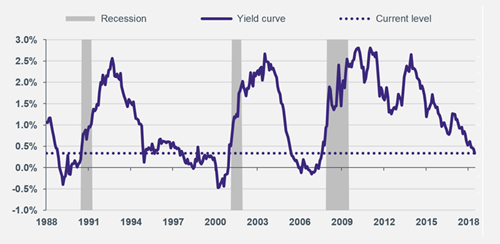
There have been many articles written recently about a measure that fund managers study to anticipate an economic downturn. This measurement is the yield curve and particularly an inverted yield curve. An inverted yield curve is when long-term interest rates are lower than short-term interest rates. It is rightly considered to be a good recession indicator, which itself is strongly correlated with negative equity markets. The yield curve has recently become flatter but not inverted (graph source: Kames Capital). Equities usually decline sharply during recessions and the recent flattening of the yield curve could be considered a signal to sell equities. However, there are two major reasons why it might be too early to be selling equities.
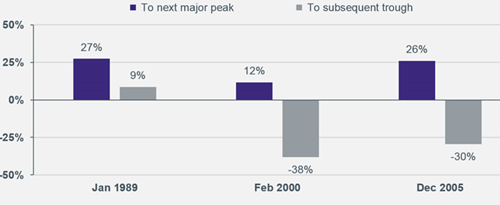
Firstly, equity markets often deliver strong returns during the late part of an economic cycle. The chart below from Kames Capital shows US equity market returns from the date of each yield curve inversion until the next major equity market peak (purple bar) and the bottom of the subsequent equity market trough (grey bar).For example, when the yield curve inverted in January 1989 the eventual market sell-off resulted in US equities still being 9% higher than at the initial date of the yield curve inversion. Secondly, despite the recent flattening, the yield curve has not yet inverted.
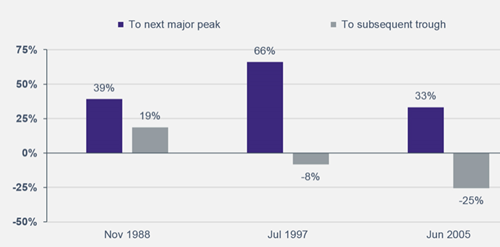
The chart below from Kames Capital shows equity market returns from the yield curve reaching its current level of 0.33% until the next major peak and subsequent trough. Some are looking at recent history and suggesting a negative market outlook. However, it could be they risk missing out on the potential for substantial late-cycle returns in equities. Calling the top of the market is notoriously difficult. Not impossible. But on balance, it would seem equity markets still have further to run from here until the next major peak. January 2018 saw the US Treasury market lead government bond yields higher. The rise detracted from returns for more interest rate sensitive parts of the corporate bond market. However, high yield corporate bonds, which have a lower interest rate sensitivity, outperformed investment grade corporates and delivered a positive return. Contributing to the rise in bond yields was the improving economic backdrop.
The above article is intended to be a topical commentary and should not be construed as financial advice. Past performance is not an indicator of future returns. Any news and/or views expressed within this document are intended as general information only and should not be viewed as a form of personal recommendation.